[
Date Prev][
Date Next][
Thread Prev][
Thread Next][
Date Index][
Thread Index]
[
List Home]
|
[nebula-dev] save as bmp, or tif-fileswt xygraph
|
Hello
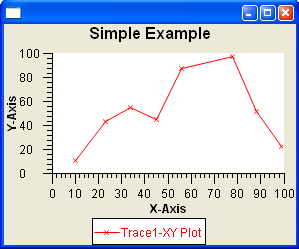
below is the code! It is easy, it just gives a simple plot. How can I save this plot (xygraph) as
a bmp or jpg-file on the PC ? I posted the question on several forums, either the answer is too
complicated or the problem is too trivial for the community.
A hint would be very helpful!
thanks!
package org.eclipse.nebula.visualization.xygraph.examples;
/*******************************************************************************
* Copyright (c) 2010 Oak Ridge National Laboratory.
* All rights reserved. This program and the accompanying materials
* are made available under the terms of the Eclipse Public License v1.0
* which accompanies this distribution, and is available at
* http://www.eclipse.org/legal/epl-v10.html
******************************************************************************/
import org.eclipse.draw2d.LightweightSystem;
import org.eclipse.nebula.visualization.xygraph.dataprovider.CircularBufferDataProvider;
import org.eclipse.nebula.visualization.xygraph.figures.Ixygraph;
import org.eclipse.nebula.visualization.xygraph.figures.Trace;
import org.eclipse.nebula.visualization.xygraph.figures.xygraph;
import org.eclipse.nebula.visualization.xygraph.figures.Trace.PointStyle;
import org.eclipse.swt.widgets.Display;
import org.eclipse.swt.widgets.Shell;
/**
* A very simple example.
*
* @author Xihui Chen
*
*/
public class SimpleExample {
public static void main(String[] args) {
final Shell shell = new Shell();
shell.setSize(300, 250);
shell.open();
// use LightweightSystem to create the bridge between SWT and draw2D
final LightweightSystem lws = new LightweightSystem(shell);
// create a new XY Graph.
Ixygraph xygraph = new xygraph();
xygraph.setTitle("Simple Example");
// set it as the content of LightwightSystem
lws.setContents(xygraph);
// create a trace data provider, which will provide the data to the
// trace.
CircularBufferDataProvider traceDataProvider = new CircularBufferDataProvider(false);
traceDataProvider.setBufferSize(100);
traceDataProvider.setCurrentXDataArray(new double[] { 10, 23, 34, 45, 56, 78, 88, 99 });
traceDataProvider.setCurrentYDataArray(new double[] { 11, 44, 55, 45, 88, 98, 52, 23 });
// create the trace
Trace trace = new Trace("Trace1-XY Plot", xygraph.getPrimaryXAxis(), xygraph.getPrimaryYAxis(), traceDataProvider);
// set trace property
trace.setPointStyle(PointStyle.XCROSS);
// add the trace to xygraph
xygraph.addTrace(trace);
Display display = Display.getDefault();
while (!shell.isDisposed()) {
if (!display.readAndDispatch())
display.sleep();
}
}
} Attachment:
SimpleExample.PNG
Description: PNG image