|
Hi Alex
GitPod just runs the latest source code and starts the Trace Compass server as trace server back-end. The xy tooltip label is taken from the XY series label which is taken from the fetchXY() back-end call.
My understanding is that you have a custom trace server. Please verify the label of the series returned. In the front-end follow method call AbstractXYOutputComponent#updateXY(). It will call the back-end and will construct the UI data model to be displayed.
Looking forward to the contribution.
BR
Bernd
From: tracecompass-dev <tracecompass-dev-bounces@xxxxxxxxxxx> on behalf of Alex Doan <vadoan@xxxxxxxxxxxxxx>
Sent: September 14, 2022 5:15 PM
To: tracecompass developer discussions <tracecompass-dev@xxxxxxxxxxx>
Subject: Re: [tracecompass-dev] Customizing the tooltip in XY graph in theia trace viewer
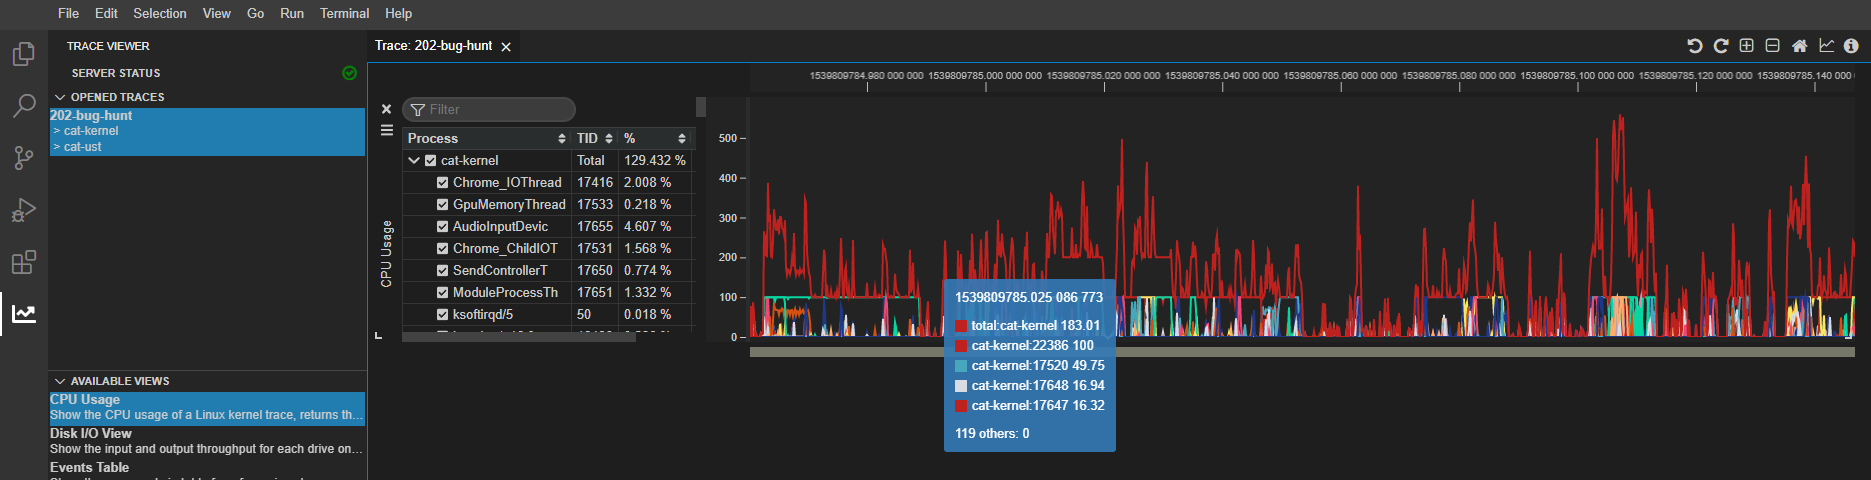
Hello Bernd, thank you for your reply. I have solved the quark graph visibility issue thanks to your help. During my preparation for contribution, I run the gitpod demo and I noticed that the tooltip here shows the name of the quarks
instead of their numbers. Could you give me an advice on how to replicate the gitpod demo’s functionality on my plugin, or where I should look into? Thank you very much. Attached is a screenshot I took from the gitpod demo.
Regards,
Alex
From: tracecompass-dev <tracecompass-dev-bounces@xxxxxxxxxxx>
On Behalf Of Bernd Hufmann via tracecompass-dev
Sent: Monday, September 12, 2022 14:53
To: tracecompass developer discussions <tracecompass-dev@xxxxxxxxxxx>
Cc: Bernd Hufmann <bernd.hufmann@xxxxxxxxxxxx>
Subject: Re: [tracecompass-dev] Customizing the tooltip in XY graph in theia trace viewer
|
CAUTION - This email is from an external source. Please be cautious with links and attachments. (go/taginfo)
|
Thanks for the interest in the theia trace viewer.
The XY chart tooltip is currently solely generated in the front-end. The XY chart TSP API doesn't have an endpoint for querying tooltip information from the trace server back-end. Only the time
graph data provider has such functionality. The plan has been to add that tooltip endpoint to the XY charts so that some domain specific information can be shown dynamically as part of the tooltip. The support of this feature would be a full-stack implementation.
The interface ITmfXYDataProvider would be the starting point. Then the new interface would have to be called in the DataProviderService from a new xy tooltip endpoint. The typescript implementations will also need to be updated to support it in the front-end.
We don't have any estimate when we can prioritize this. However, we would gladly support and review any contributions for that.
> Also, I'm trying to prevent some quarks from showing up on the graph. I'm looking into it but would appreciate any help. Thank you!
The trace viewer front-end is quite lean and doesn't know about the domain and content that it displays. There is no filtering mechanism in front-end available
to hide certain series. Filtering on the XY chart, would be interesting enhancement to the application. In general, the data to be shown is determined by the backend and the data provider implementation. So, if you have a custom data provider implementation,
then you can remove certain series. If you don't have a custom data provider, then could extend the DataProviderService class, register the new DataProviderService class and in the extension you remove series that you don't want. If you do so, you would have
to build your own trace server application based on the Trace Compass trace server.
Hi, I'm looking for a way to customize the tooltip in the theia trace viewer. Currently my plugin looks like this:
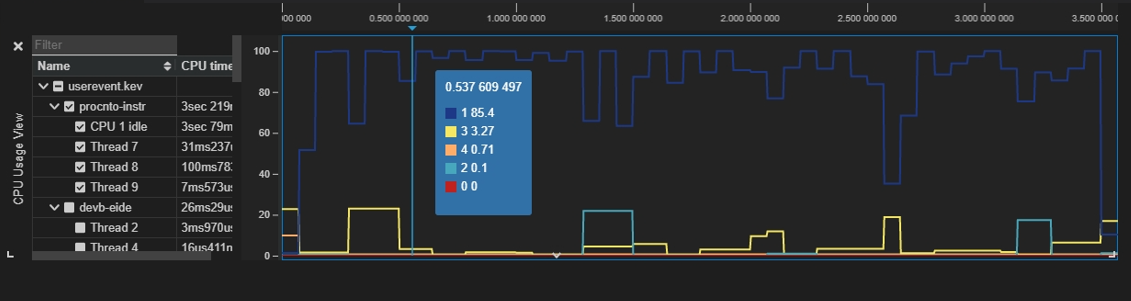
I would like it to show the name of the quark instead of just the quark number, so the tooltip can act as a legend for viewer. Something
like this:

Any help is greatly appreciated. I have looked into the document but I couldn't find any convenient way to customize tooltip for XY
graph like the fetchTooltip method in ITimeGraphDataProvider.
Also, I'm trying to prevent some quarks from showing up on the graph. I'm looking into it, but would appreciate any help. Thank you!
Regards,
Alex
This transmission (including any attachments) may contain confidential information, privileged material (including material protected by the solicitor-client or other applicable privileges), or constitute non-public information. Any use
of this information by anyone other than the intended recipient is prohibited. If you have received this transmission in error, please immediately reply to the sender and delete this information from your system. Use, dissemination, distribution, or reproduction
of this transmission by unintended recipients is not authorized and may be unlawful.
This transmission (including any attachments) may contain confidential information, privileged material (including material protected by the solicitor-client or other applicable privileges), or constitute non-public information. Any use of this information
by anyone other than the intended recipient is prohibited. If you have received this transmission in error, please immediately reply to the sender and delete this information from your system. Use, dissemination, distribution, or reproduction of this transmission
by unintended recipients is not authorized and may be unlawful.
|