We have created a custom trace that extends CtfTmfTrace and an analysis by extending CallStackAnalysis and CallStackStateProvider. We are using TraceCompass 3.1. The analysis appears to be working correctly and the call stack view looks good. I also noticed that we get the Flame Graph "for free" since we have extended CallStackAnalysis. However, we are seeing some strange behavior with the Flame Graph.
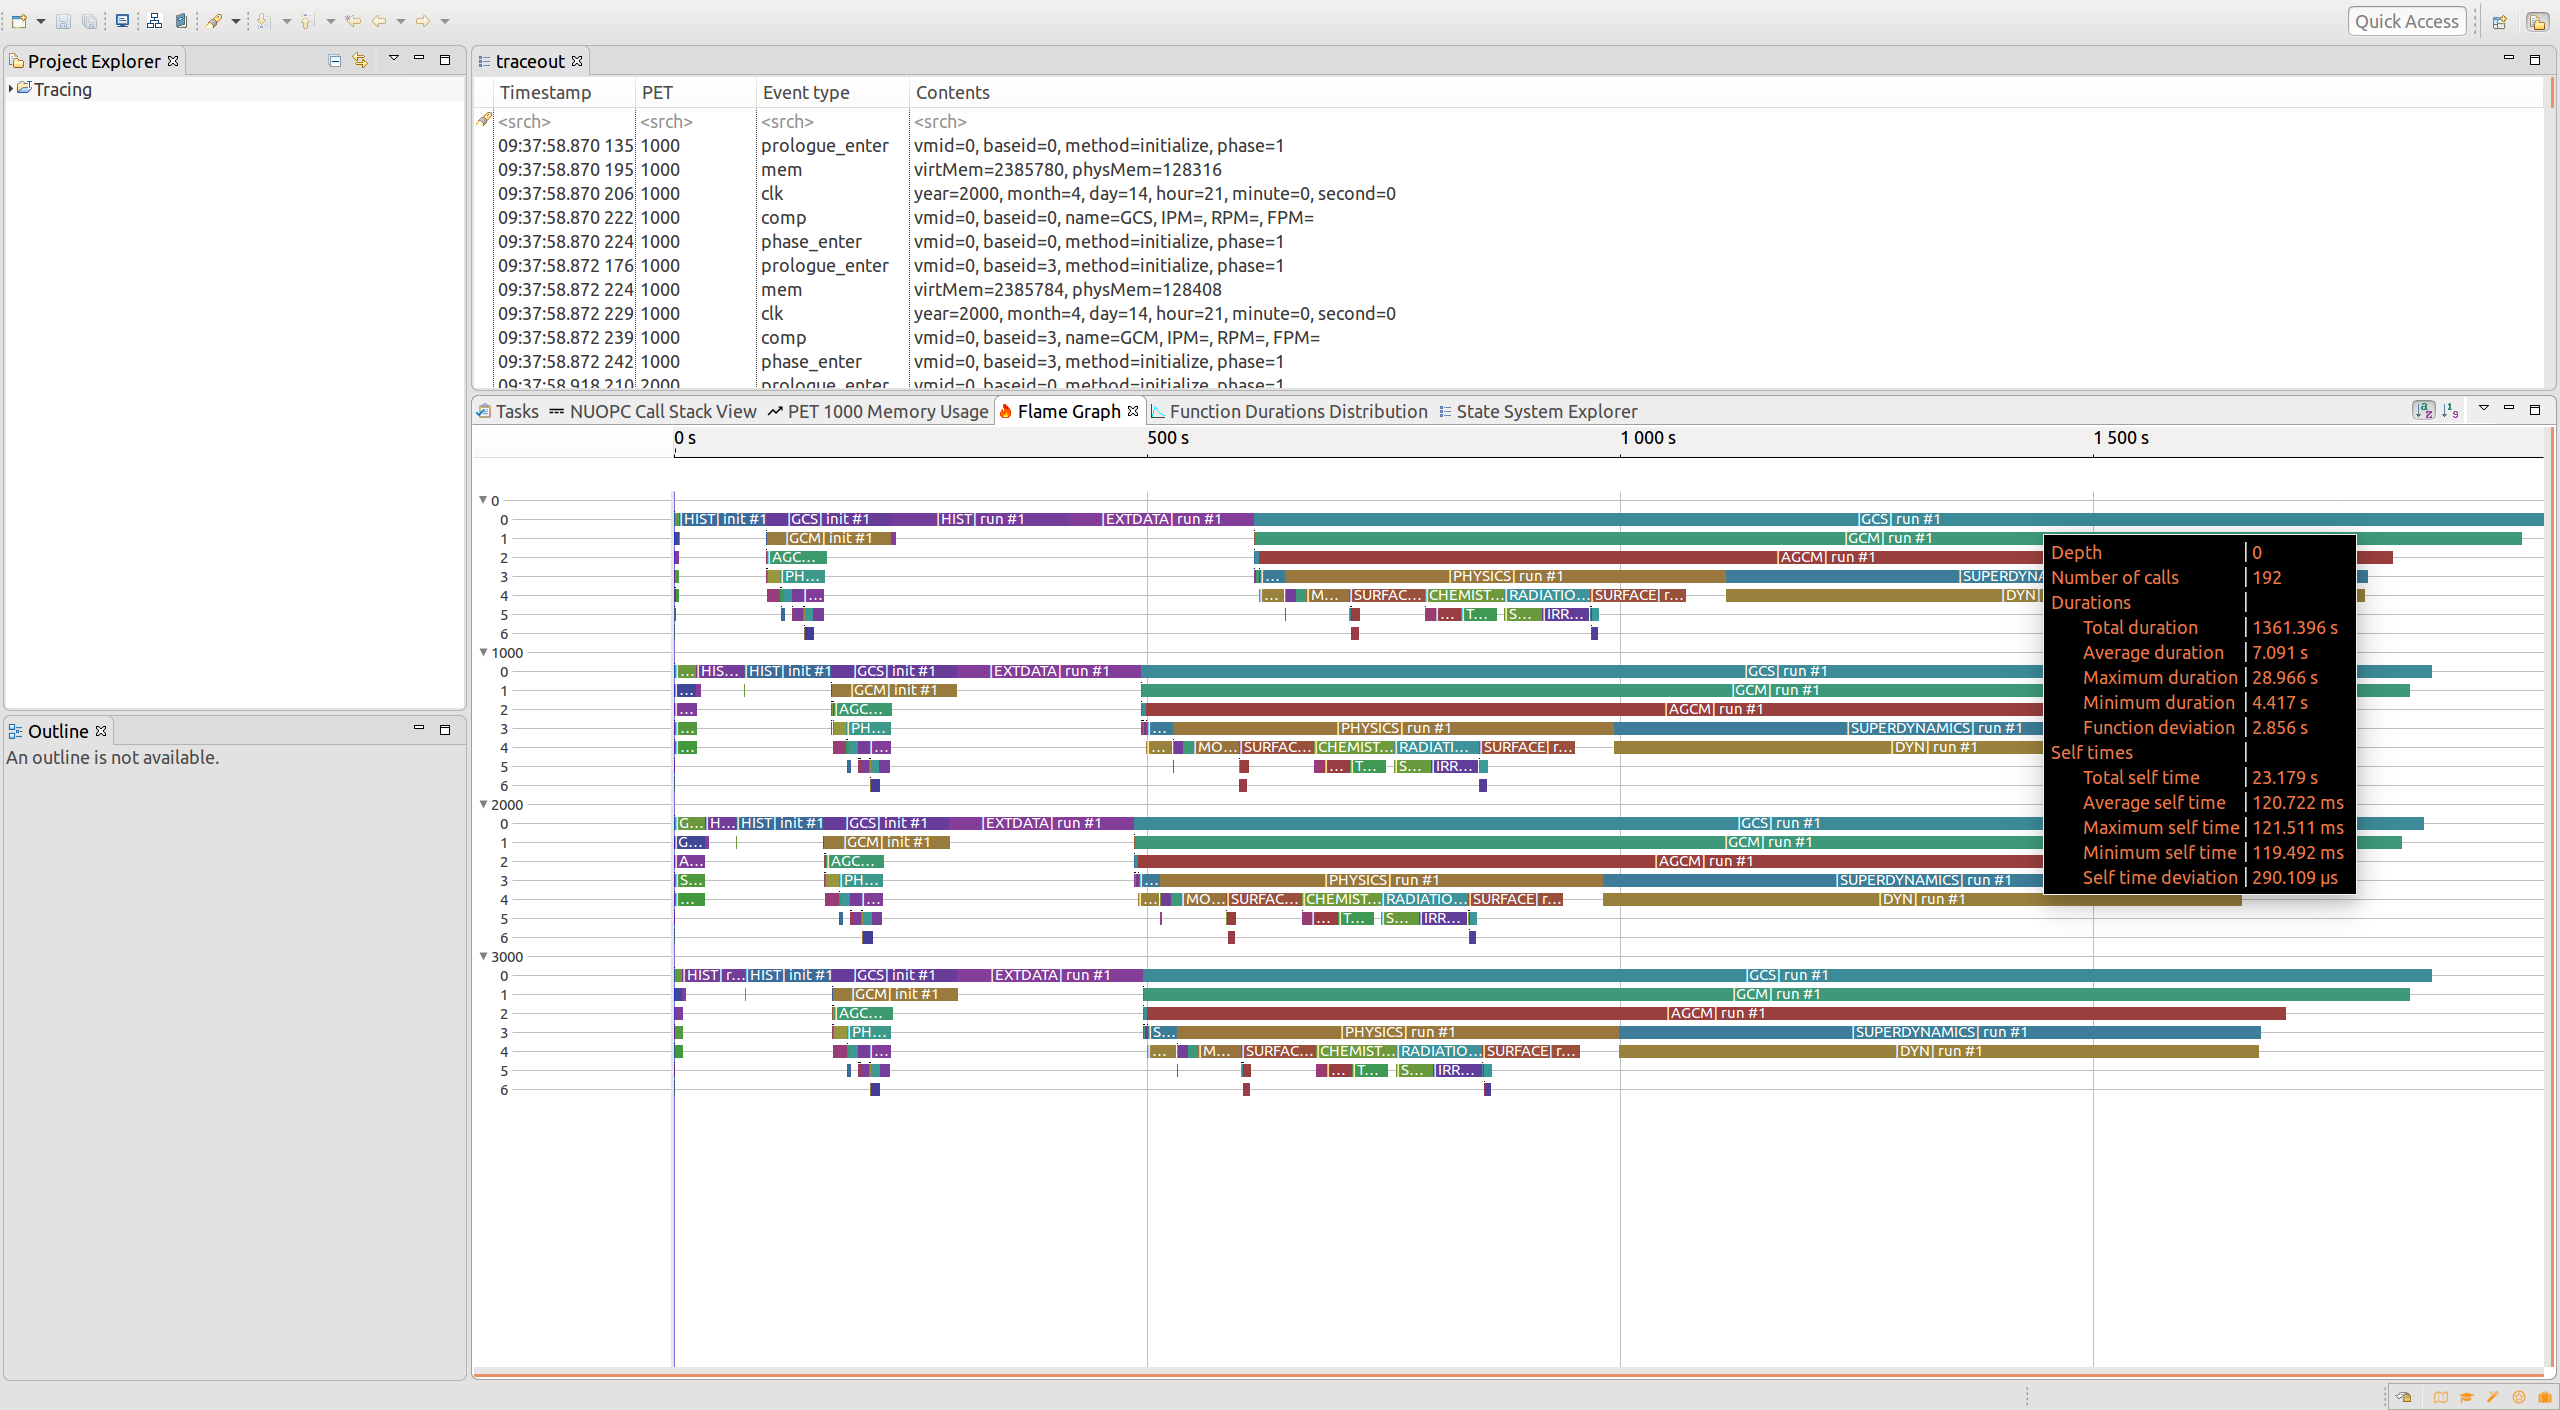
When I first load the trace, the "per thread" Flame Graph looks correct. See below where there are four threads (each in a separate process) and notice that the function named "[GCS] run #1" has 192 calls in each thread.
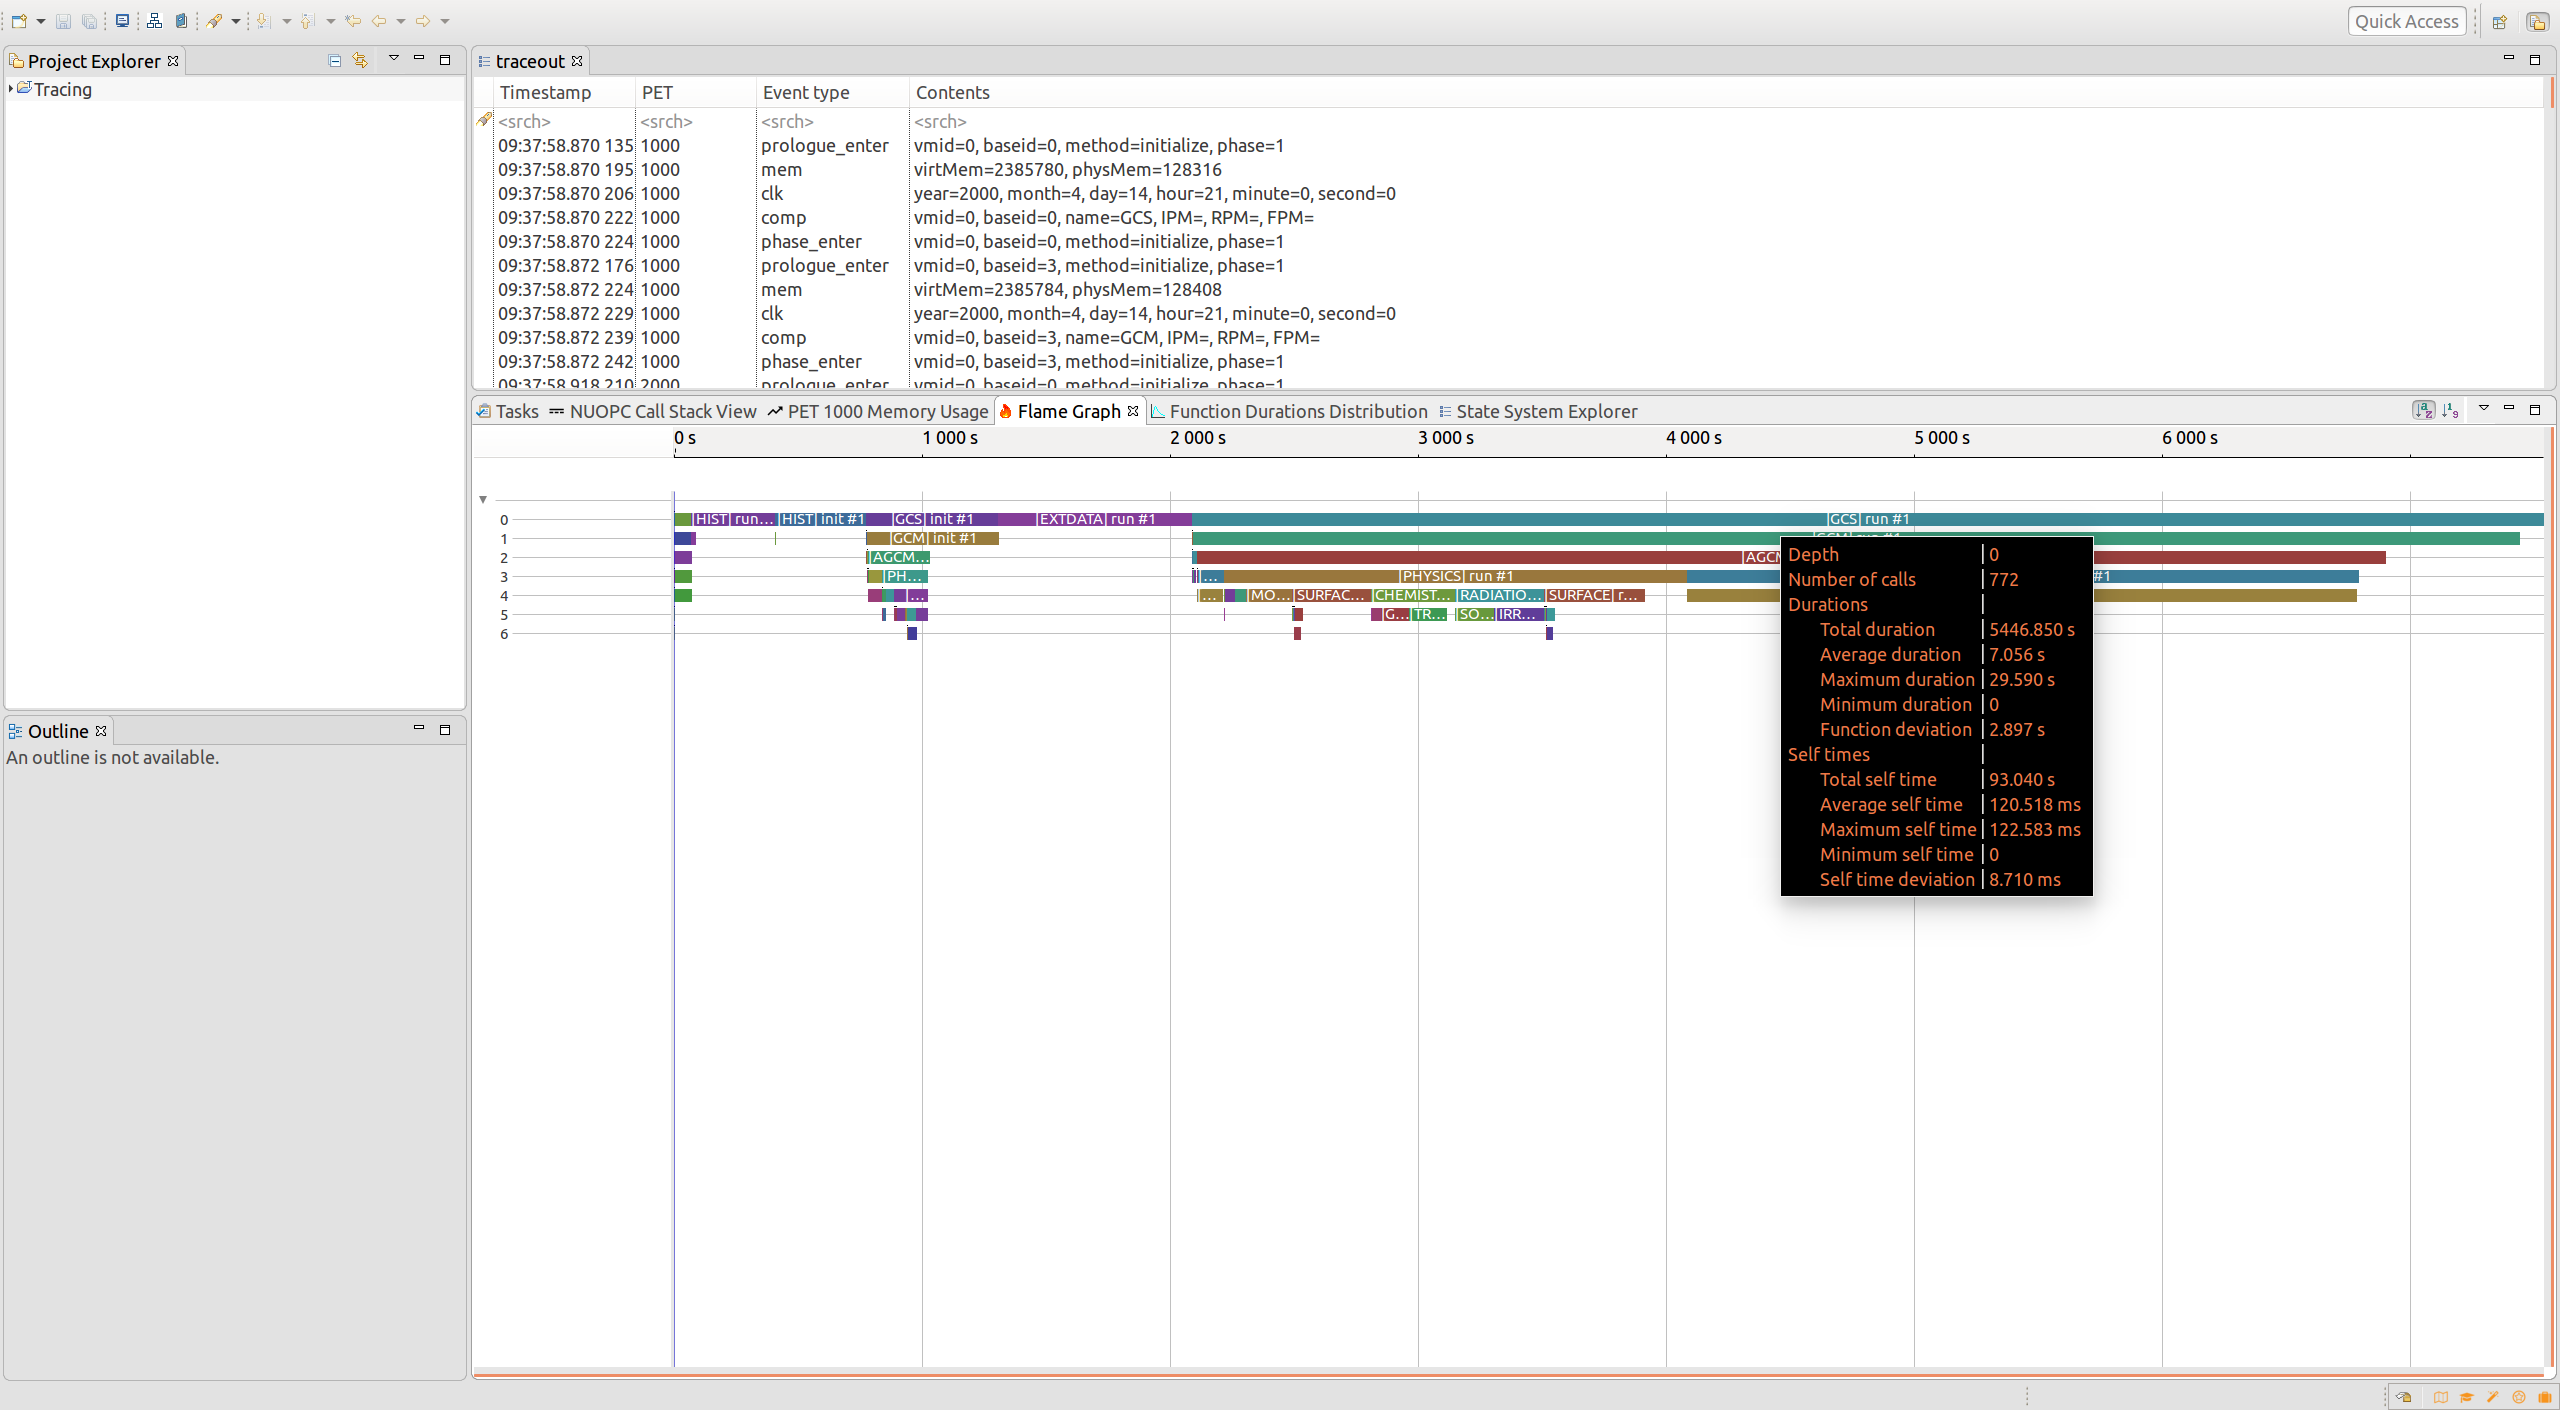
Then, I immediately switch to "aggregate threads view" and see that the total number of calls for "[GCS] run #1" is 772, but I think this should be 192*4 = 768.
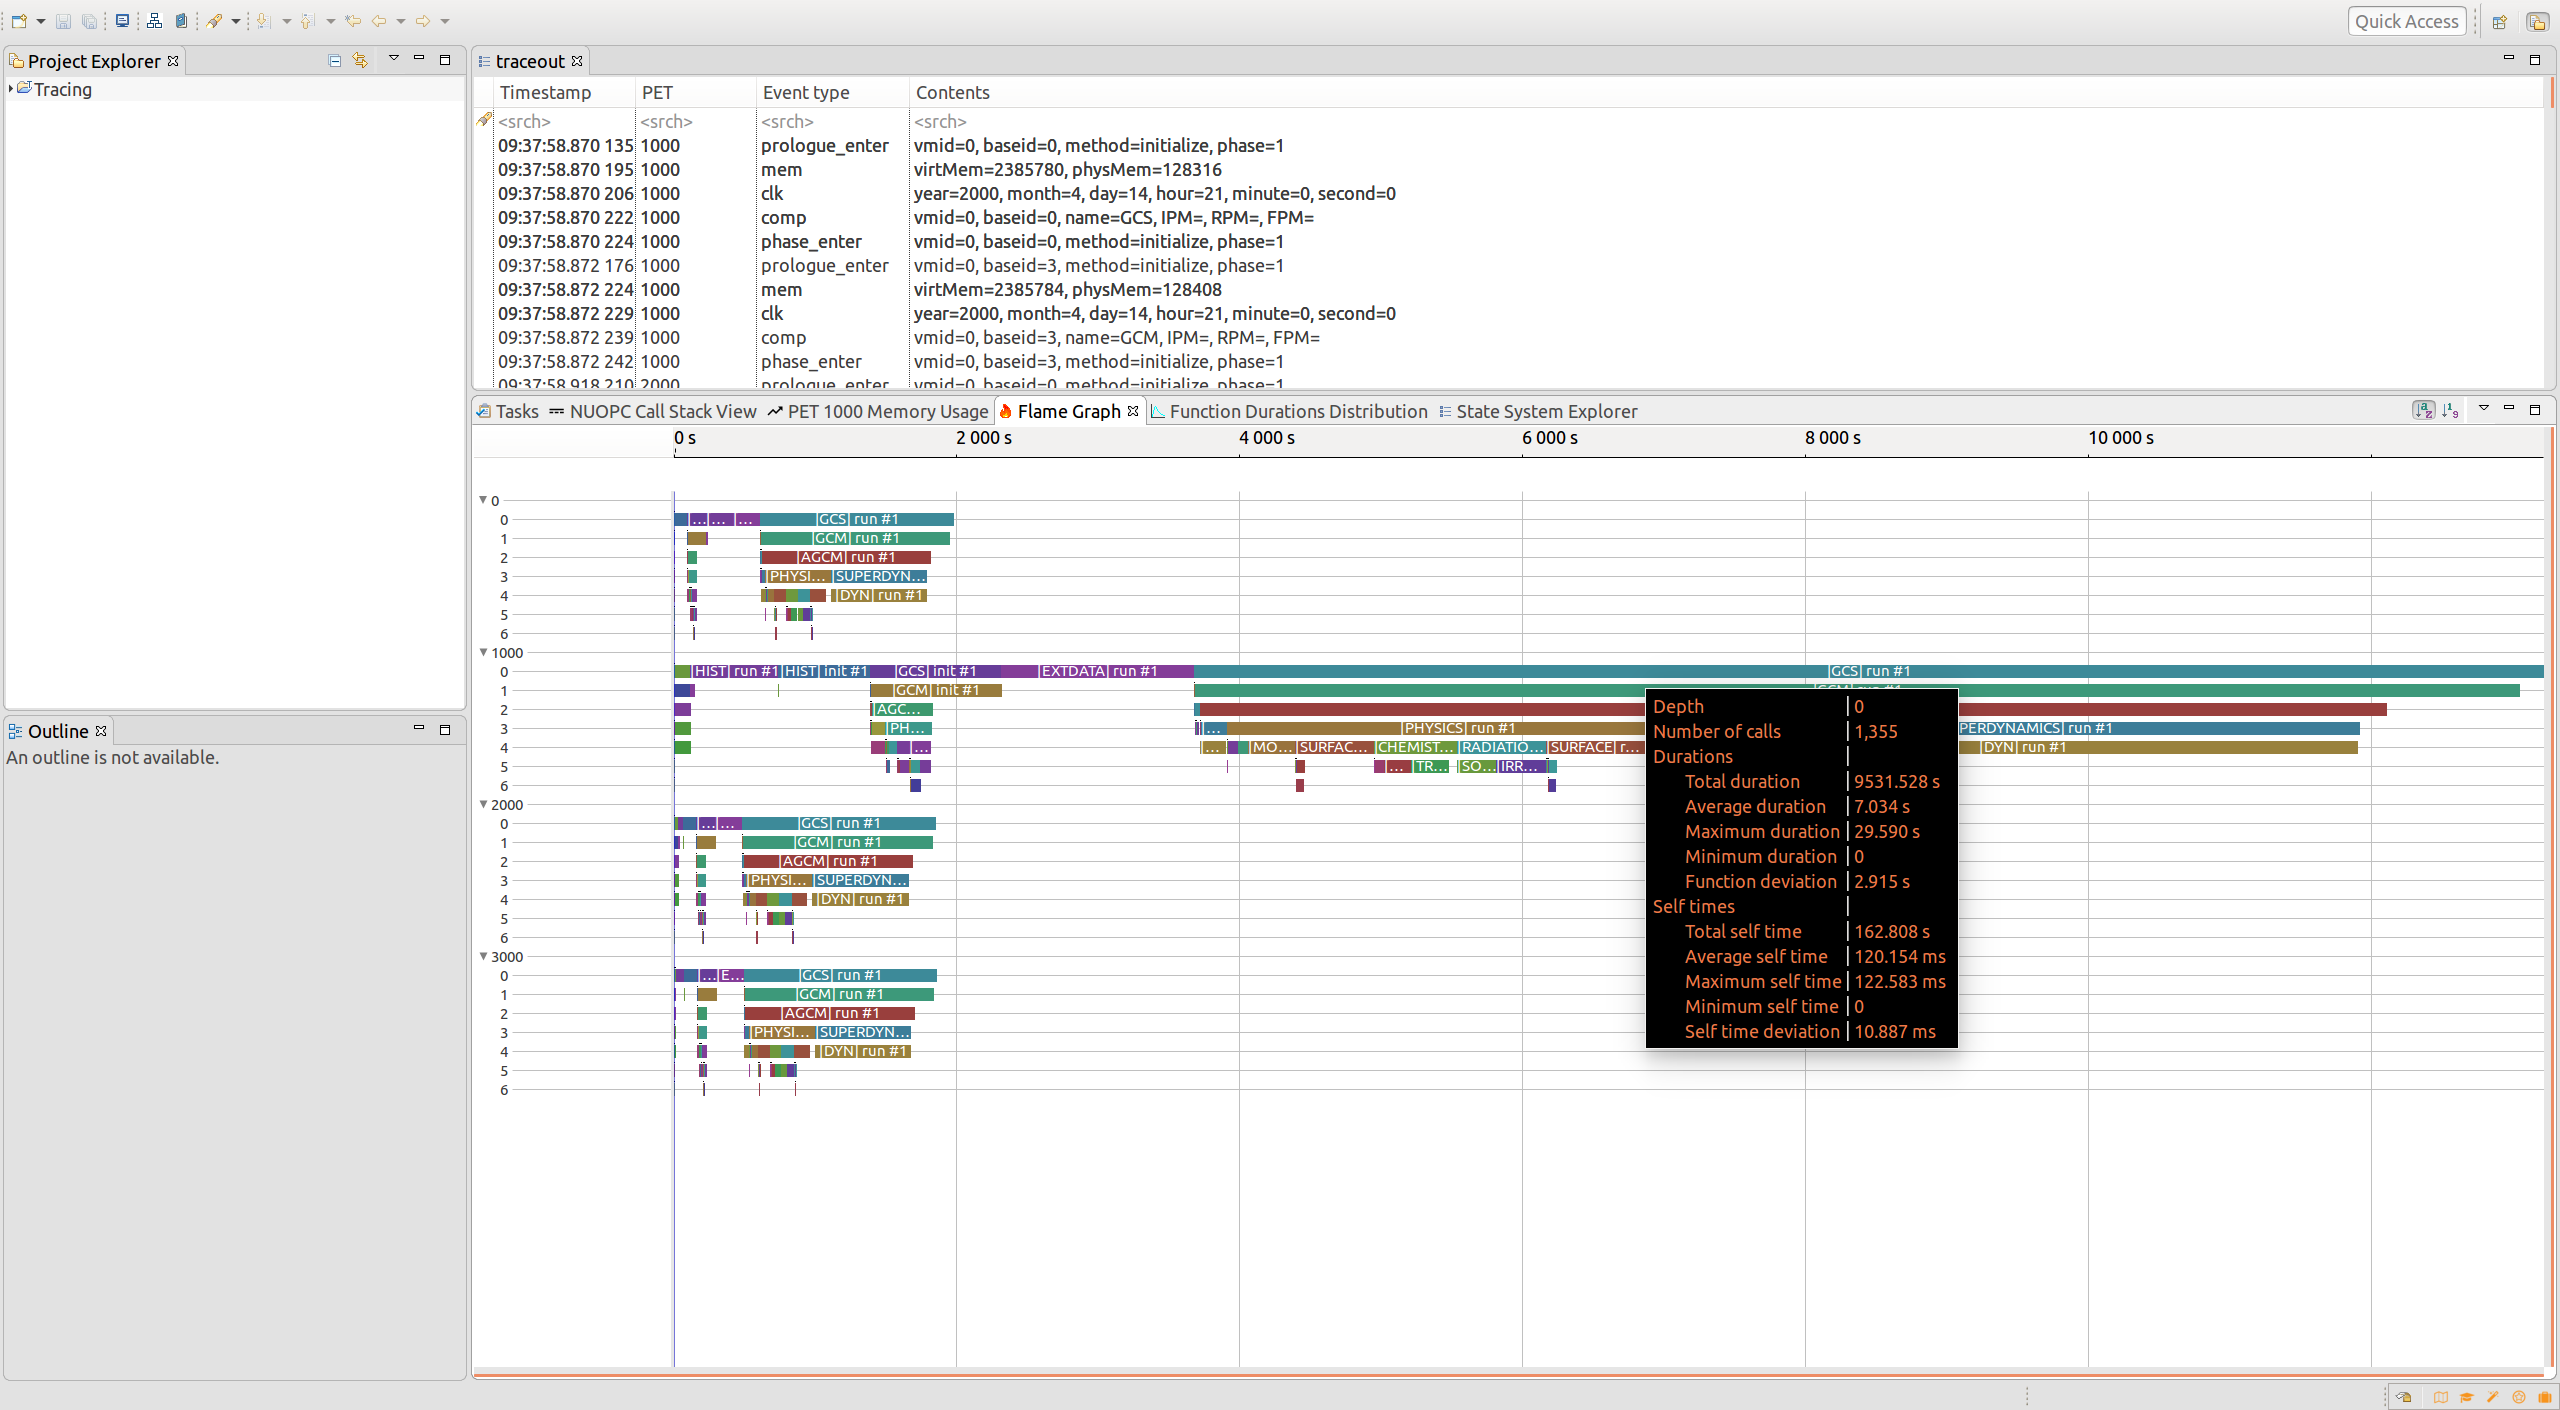
Then, the really strange part is when I switch back to "per thread" view I see that one of the threads shows 1355 calls to "[GCS] run #1". I would expect this view to be identical to the first time viewing the "per thread" view.
Now, when I switch back to the aggregate view, the total number of calls for this function has gone up to 2530. I am suspicious that this is not the expected behavior. However, since I have created a custom CtfTmfTrace, maybe I do not have something set up in the state system / attribute tree. The strange this is that the call stack view itself works great. Keep in mind that these four threads are in four different processes--no idea if that may shed light on the strange behavior.
Any ideas?
Rocky