[
Date Prev][
Date Next][
Thread Prev][
Thread Next][
Date Index][
Thread Index]
[
List Home]
|
Re: [science-iwg] EclipseCon France
|
Jacob,

we also use SWT and JavaFX in a mixed modus in OpenChrom.
The aforementioned charting library will be based on SWT and SWTChart.
But it would be great to have an additional library e.g. to plot
interactive radar, circle, pie or 3d charts with JavaFX. But that's
another story.
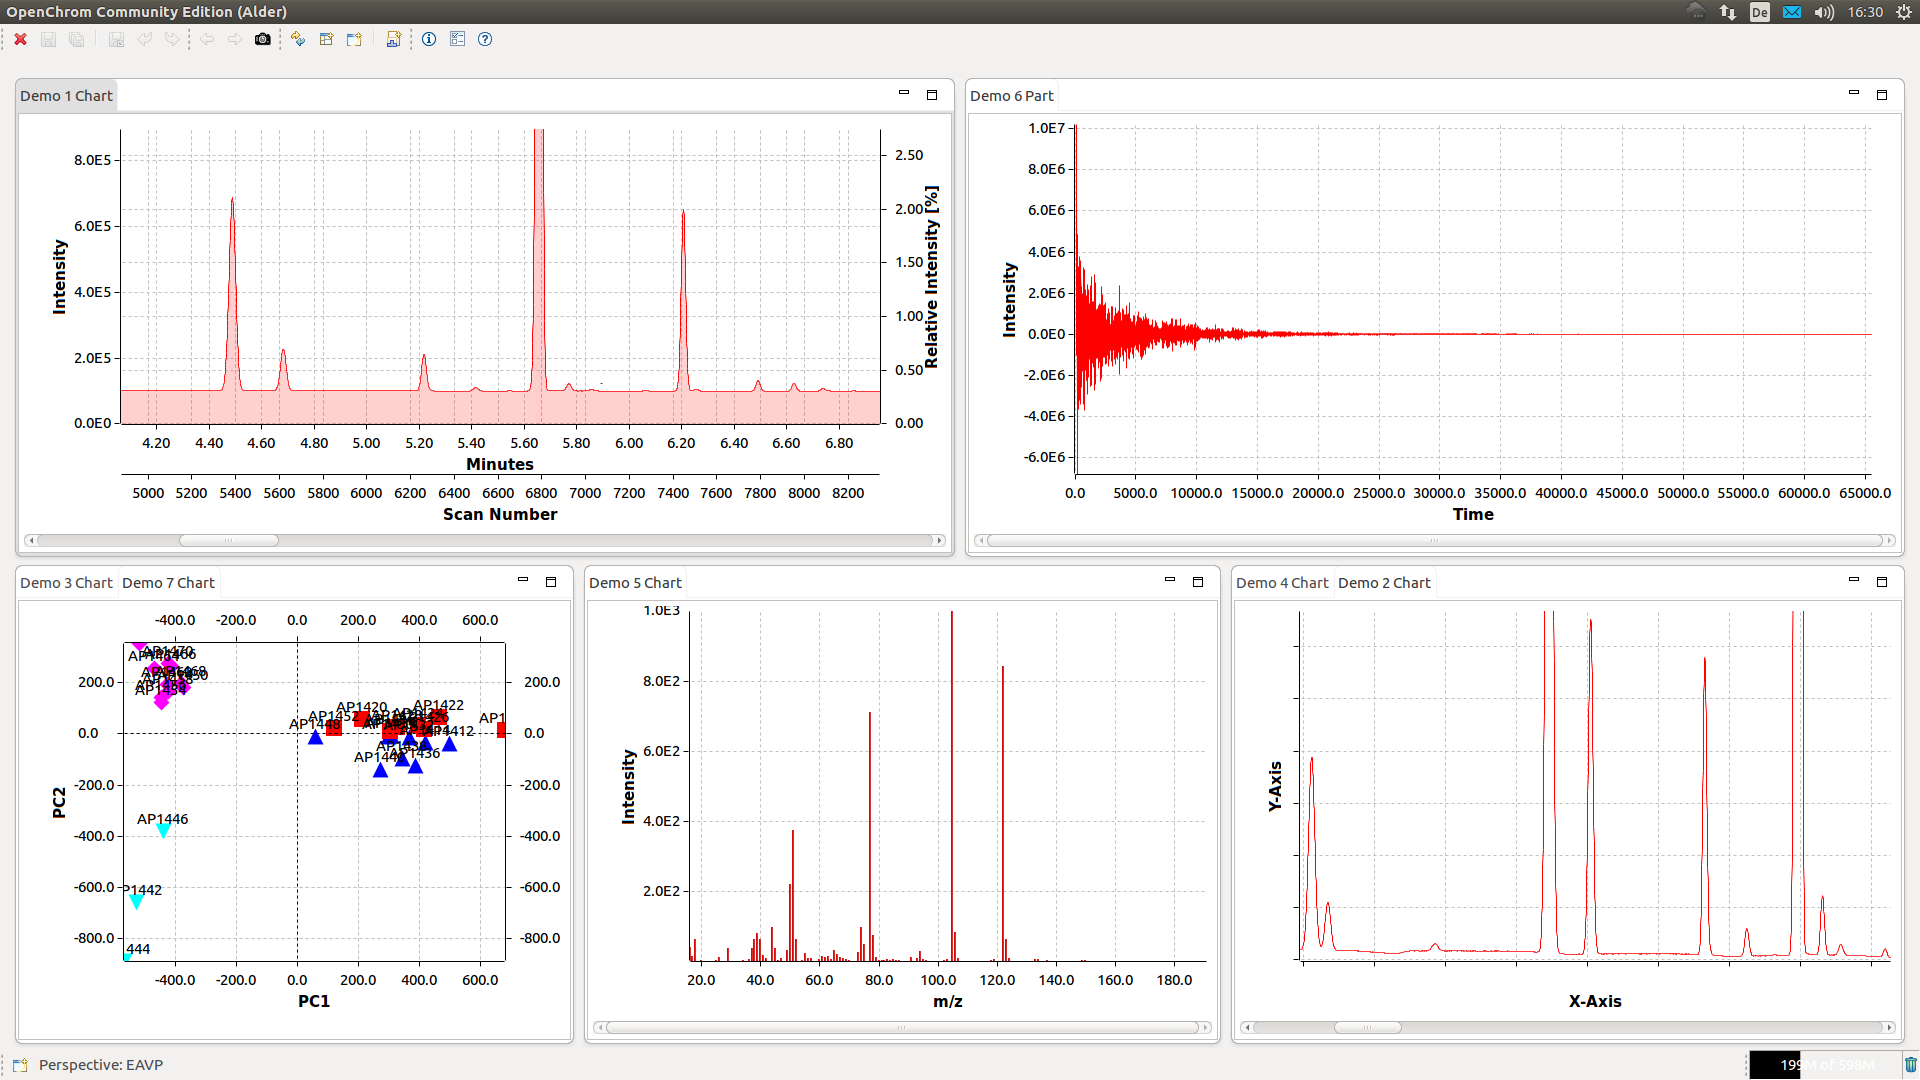
Please find a screenshot of the current work I made to create a flexible
library. Data is supported via double[] arrays. The next thing would be
to bind it to IDataset ... anyhow, step after step. Currently, I'm a bit
behind my schedule, but I assume that the library will be in a early
preview state by end of March. Then it will be also migrated to EAVP.
Currently the code is hosted here:
http://git.eclipse.org/c/chemclipse/org.eclipse.chemclipse.chemclipsecore.git/tree/chemclipse/plugins/org.eclipse.chemclipse.ui.service.swt?h=develop&id=34ca86b5de3138b559244ddd9e41ab1ececae74c
I totally agree with you, that plotting is the next thing beside of
January to eventually create an Eclipse Science release.
Best,
Philip


Am 16.02.2017 um 11:37 schrieb Jacob.Filik@xxxxxxxxxxxxx:
Hi Folk,

That talk looks very interesting Philip, I made my first commit to XYGraph last week, and I think plotting should probably be the next thing to work together on, in the January style, to start making more of this group. Maybe I should see if it is not too late to head to eclipse con....

It really doesn't feel like the most efficient use of time to be developing effectively 3 different Draw2D plotting systems (XYGraph, the Diamond fork of XYGraph and swtgraph). We do a lot of work on our fork, and it seems a shame to not be pushing this back (hence my first commit to XYGraph), but our needs are greater than just line graphs (images - including those of different resolutions, false colour mapped and RGB, vector plots, all overlaid at the same time, exportable as SVG), so it is not a trivial task. Our XYgraph fork is probably one of the most used pieces of UI in Diamond, so we tend to tread carefully with it.

I feel if people are interested in do work on graphing it might again be worth stealing the python communities ideas. In my eyes the most powerful part of Matplotlib is that the code for generating a plot is completely decoupled from what is drawing the plot, hence they can render on tk, wx, qtk, SVG, pdf, etc. A Java graph based on a switchable renderer that works on SWT, swing and JavaFX would be fantastic, although undoubtedly a lot of work. Maybe a common plotting api would be a start.

If you already use JavaFX (which we do), then using the Plotly.js library (or many others) in a WebView, is always an option, and something I have looked into. The line graph seem fine and the webgl plots are cool but I'm not sure how quickly it will draw a 4k x 4k image as a heat map, which is a pretty common use case for us.

Anyway, just my 2 cents worth,

Jake

Dr Jacob Filik
Senior Software Scientist
Tel: +441235 77 8690
Diamond Light Source Ltd.
Diamond House
Harwell Science & Innovation Campus
Didcot
Oxfordshire
OX11 0DE


-----Original Message-----
From: science-iwg-bounces@xxxxxxxxxxx [mailto:science-iwg-bounces@xxxxxxxxxxx] On Behalf Of Philip Wenig
Sent: 16 February 2017 09:37
To: Science Industry Working Group <science-iwg@xxxxxxxxxxx>
Subject: [science-iwg] EclipseCon France

Hi folks,

I've proposed a session for the EclipseCon France:
https://www.eclipsecon.org/france2017/session/charts-eclipse-people-making

It would be great to see a lot of other people from our Science community in Toulouse.
Don't hesitate to submit proposals!


Best,
Philip
--
~~~~~~~~~~~~~~~~~~~~~~~~
OpenChrom - the open source alternative for chromatography / mass spectrometry
Dr. Philip Wenig » Founder » philip.wenig@xxxxxxxxxxxxx » http://www.openchrom.net
~~~~~~~~~~~~~~~~~~~~~~~~
Attachment:
Charts.png
Description: PNG image