| Hi, I have a question about ETFw. I am doing a very basic test with the following XML:
<?xml version="1.0" encoding="UTF-8"?>
<toolset.01>
<tool name="echo">
<execute>
<utility command="echo">
<argument value="hello" />
<argument value="world" />
</utility>
</execute>
</tool>
</toolset.01>
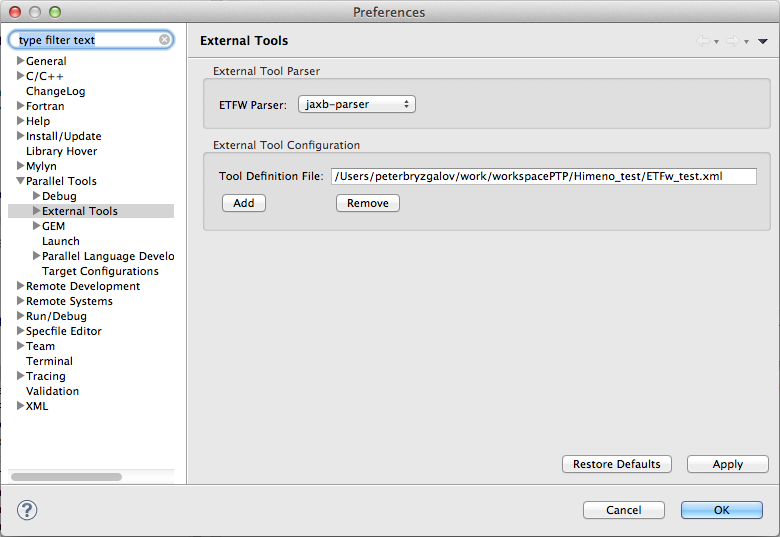
I have added the file to External Tools in Eclipse preferences:
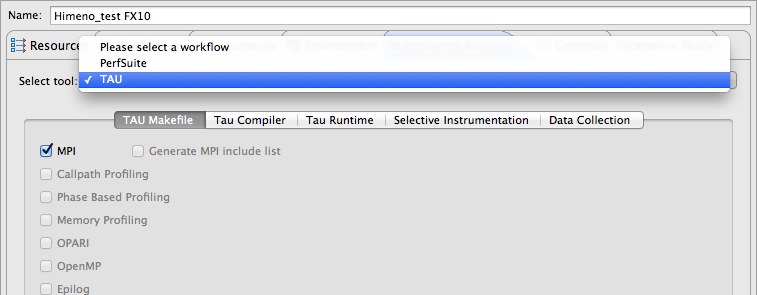
Then I open Profile Configurations for a synchronised Fortran project, but do not see the new tool there:
What am I doing wrong?
I have yet another question. Job is started on the target system, but then finishes with an error:
+ mpiexec /volume/home/peterbryz/Himeno_test/himenoBMTxp
jwe0001a pause
jwe0001a pause
jwe0001a pause
jwe0001a pause
jwe0001a pause
jwe0001a pause
jwe0001a pause
jwe0001a pause
[ERR.] PLE 0014 plexec The process terminated abnormally.(rank=0)(nid=0xff01006c)(exitstatus=0)(CODE=2032,1966080,0)
[ERR.] PLE The program that the user specified may be illegal or inaccessible on the node.(nid=0xff01006c)
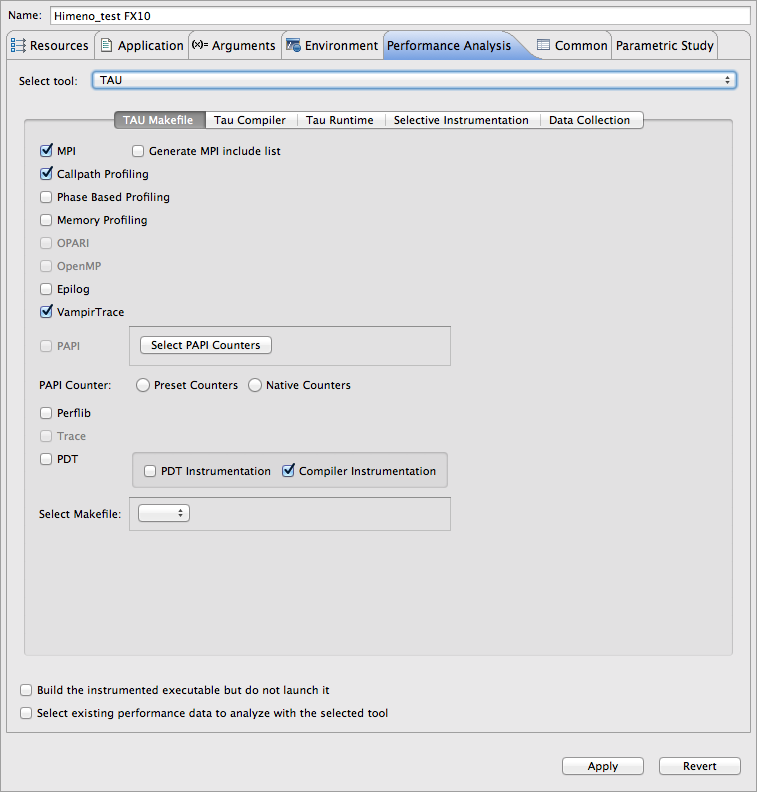
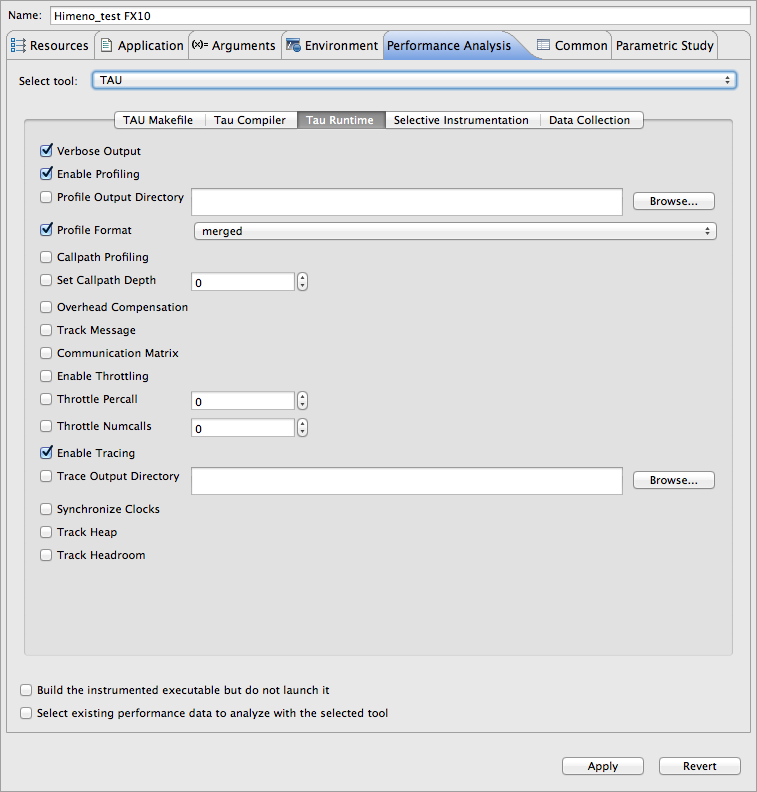
Here are my profiling settings: 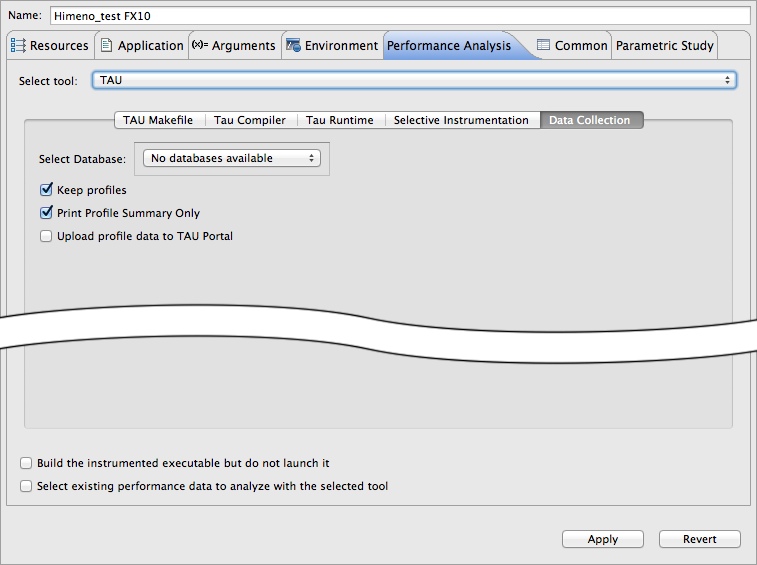 Kind regards, Peter
On 20 Feb, 2014, at 6:40, Christoph Pospiech < Christoph.Pospiech@xxxxxxxxxx> wrote: Hi,
I just tried to deploy valgrind from within a Eclipse PTP session. My mileage
varied a lot. Eventually, I ended up using valgrind from command line.
This is what I found. Did I overlook something important ?
* There is an Eclipse plugin for valgrind (as part of the Linux tools
package), but it appears to support only serial (C/C++ ?) applications.
(and it is also sprouting java NPEs).
* There seems to be the external tools framework
(http://wiki.eclipse.org/PTP/ETFw/PTP_External_Tools_Framework),
which is not a valgrind plugin, but a framework for building such a
plugin. Suspiciously, at the end of the wiki page, the text refers to PTP 3.0
release plans - and we are at PTP 7.0, correct ? Also the wiki page seems to
be in category "Pages with broken file links". Is this framework still
maintained ?
* Skimming through the documentation of the latter, a large portion appears to
be dedicated to building a GUI for specifying tool configurations. I would be
rather interested how to interpret the results. -- Or even better, how to feed
the results (from a single MPI rank) into the valgrind plugin mentioned above.
* When I said "command line", I actually meant the following. In an OpenMPI
interactive launch configuration, I set the application name to
"/usr/bin/valgrind" and pre-pended the application name (=compiled binary from
the the PTP project) to the argument list. --- That worked and placed the
shuffled output lines of size_of_MPI_COMM_WORLD valgrind sessions into the
Eclipse console. Question - How to un-shuffle the output lines and feed it into
the valgrind profiling display ?
--
Mit freundlichen Grüßen / Kind regards
Dr. Christoph Pospiech
High Performance & Parallel Computing
Phone: +49-351 86269826
Mobile: +49-171-765 5871
E-Mail: christoph.pospiech@xxxxxxxxxx
-------------------------------------------------------------------------------------------------------------------------------------------
IBM Deutschland GmbH / Vorsitzender des Aufsichtsrats: Martin Jetter
Geschäftsführung: Martina Koederitz (Vorsitzende), Reinhard Reschke, Dieter
Scholz, Gregor Pillen, Christian Noll, Ivo Koerner
Sitz der Gesellschaft: Ehningen / Registergericht: Amtsgericht Stuttgart, HRB
14562 / WEEE-Reg.-Nr. DE 99369940
_______________________________________________
ptp-user mailing list
ptp-user@xxxxxxxxxxx
https://dev.eclipse.org/mailman/listinfo/ptp-user
|