| Hi:
I'm analysing my Java application for possible memory leaks and the MAT tool is telling me that some "statistics" classes are taking up 189 MB of heap. When I select the "List objects with outgoing references" report and start drilling down it suggests that the "ReferencedFileTypeStatistic" class is using up the memory.
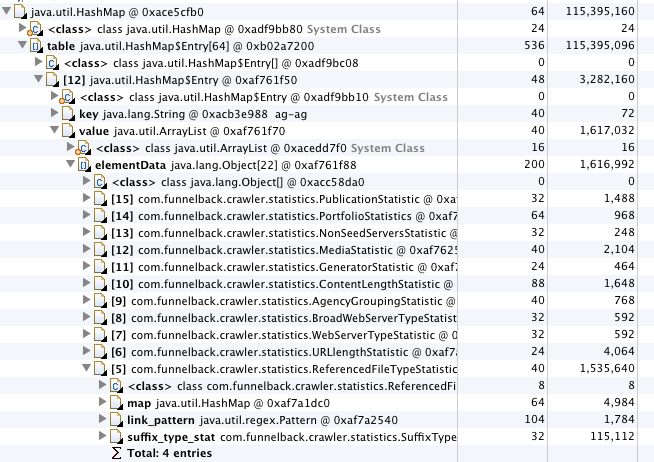
However, when I expand this reference in the report the expanded figures do not add up to the total for that object (see screenshot below):
As you can see, the total for the ReferencedFileTypeStatistic object is using 1,535,640 bytes. However, the individual components do not add up to this total. Is this behaviour expected? The map, link_pattern and suffix_type_stat objects are all ones I expect to see for this object and are approximately the right size.
So far MAT has proven to be a really useful tool and helped in identifying leaks so they could be fixed.
I'm at a loss to explain what is taking up the rest of the memory based on this report - any advice would be gratefully received.
Kind regards,
- Francis. |