[
Date Prev][
Date Next][
Thread Prev][
Thread Next][
Date Index][
Thread Index]
[
List Home]
|
[e4-dev] Profiling results: switching between editors
|
With the jar file from Tom, the E4 SDK now works fine again.
Switching between editors, however, is still very slow. I did a quick analysis with the YourKit Java Profiler, just in case it might be useful to you for some final fixes (if it's not too late already).
Here is what I did:
1. Open two text files (almost empty)
2. Start the profiler
3. Switch from one editor to the other
4. Stop the profiler
Thus, there was only a single focus transfer.
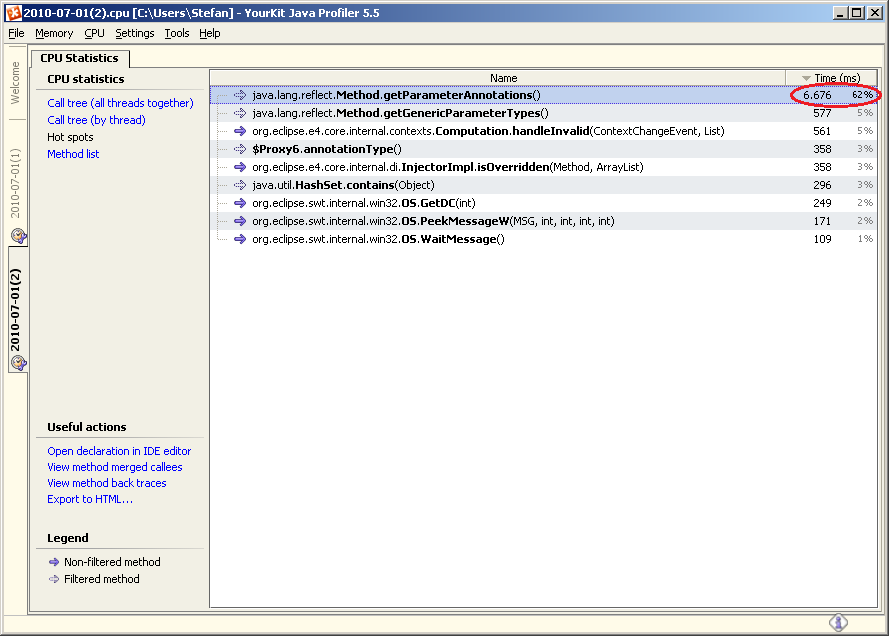
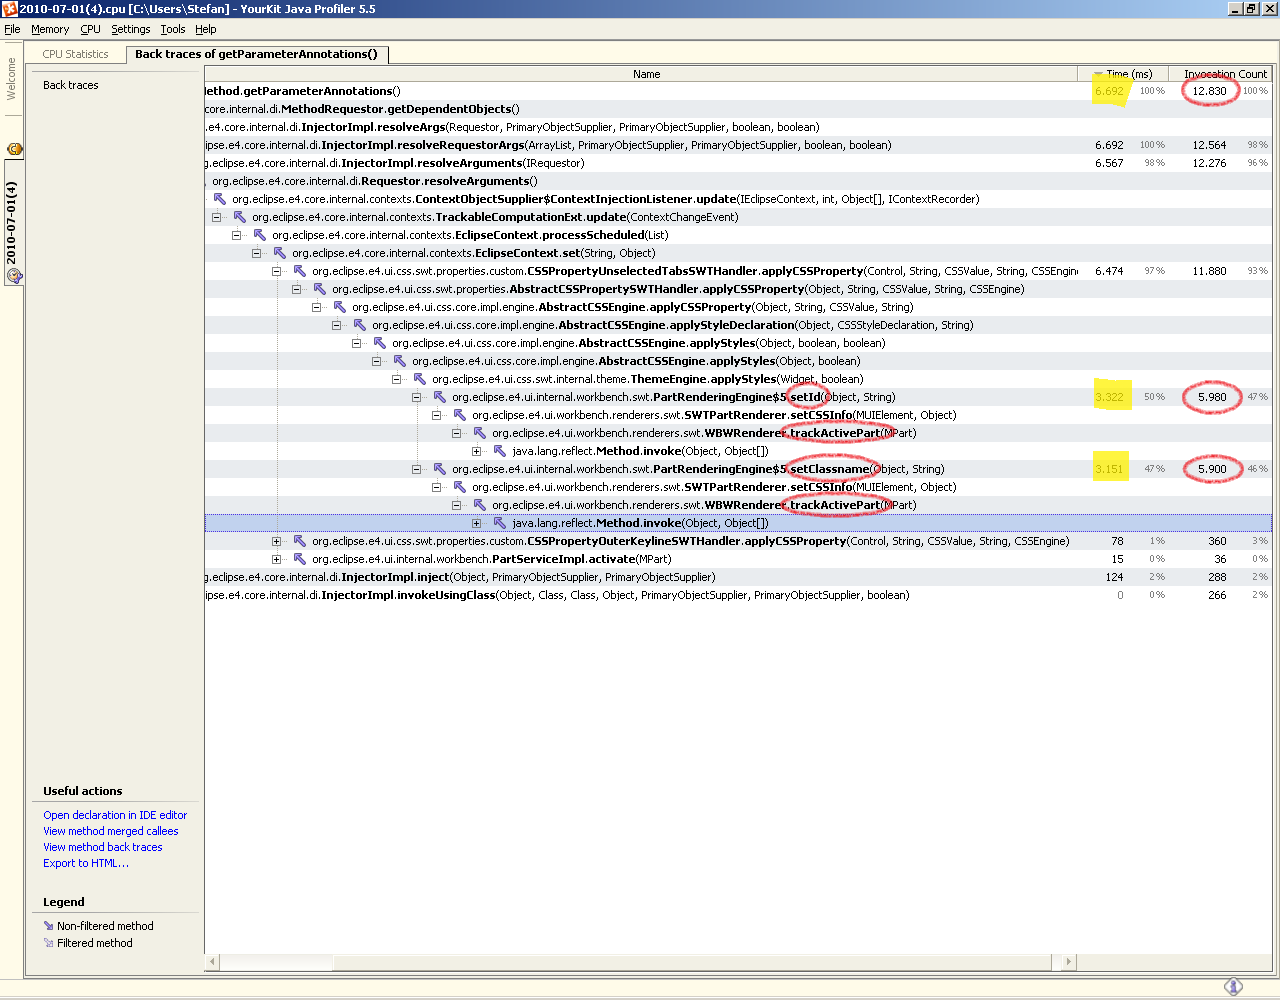
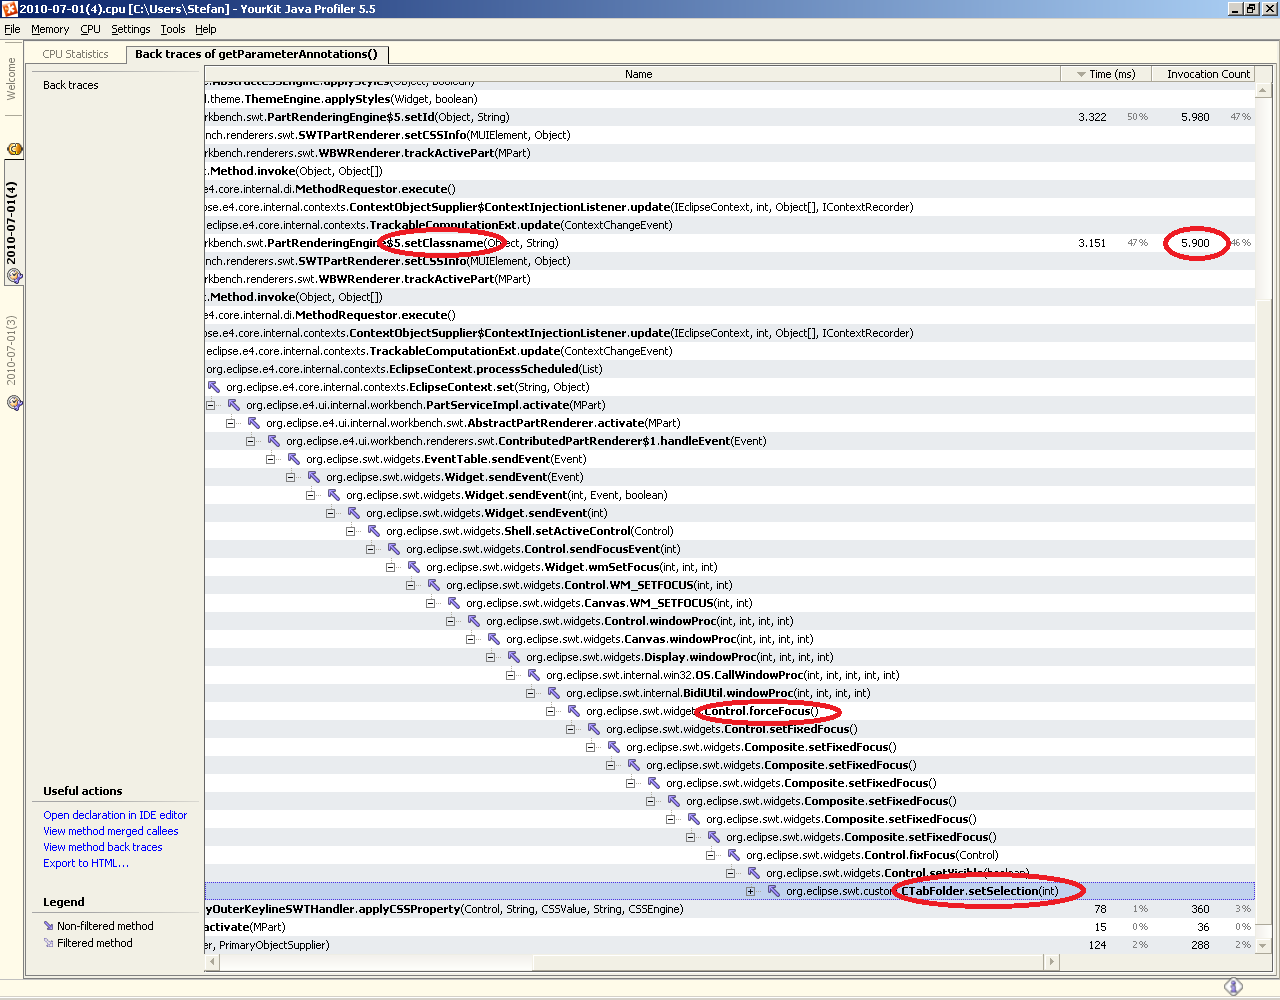
The results are (see also attached screenshots): Most of the time is consumed by the invocation of java.lang.reflect.Method.getParameterAnnotations(). For a single focus transfer, this method is called several thousand times. The back traces show that these inovations come from the setId() and setClassname() methods in the PartRenderingEngine, which in turn gets called on part activation (WBWRenderer.trackActivePart(...)).
Unfortunately, I cannot tell which method in the stack trace actually causes these many invations, because the invocation counts in the profiler are not shown (for some unknown reason).
Is there a way to reduce this high count of invocations? This would greatly improve the editor switching time.
Please let me know if I can help you with some more profiling.
Stefan Mücke
Attachment:
1-hotspots.png
Description: PNG image
Attachment:
2-backtraces.png
Description: PNG image
Attachment:
3-focus.png
Description: PNG image