
[Date Prev][Date Next][Thread Prev][Thread Next][Date Index][Thread Index] [List Home]
Re: [ajdt-dev] AJDT Performance Issues

Hi Rich,

That 2.2.3 release is quite old - we are overdue doing another release. You could upgrade to a snapshot and see if that makes any difference (honestly a snapshot passes all the same tests as a release, the only real difference is the label we give the build). But really as long as you are on AspectJ later than 1.6.8 you have the major compiler performance improvements in - but you will be missing IDE improvements.  Update site is here: http://download.eclipse.org/tools/ajdt/43/dev/update

 I wonder if it’s more popular to use aspect with LTW insead of CTW. Perhaps we are approaching this wrong.

Not really, they usually have different use cases. If you can take that weaving cost earlier on, then do so and it won’t impact every startup.

When profiling and looking at the output I did notice that our project has LOTS of compiler warnings (un-used imports, raw types, type safety, deprecated API calls etc). Would this be adding an extra overhead to AJDT that JDT manages better?

No, that shouldn’t be much different.

The marker creation times are about 30 sec

I’ll have to double check but I thought this happened asynchronously (so didn’t interfere with you being able to continue working).

> 1.5 times slower?

That isn’t totally unlikely - I need to check out the attachments to review the timings. Seeing a full compile more frequently, now that can be the sign of a bug. A bunch of work has been done to ensure incremental builds are done where possible but if there is a problem in the analysis of whether an incremental is possible, it does fall back on a full build. Basically if you are working on the aspects a full build is more likely but when just working on the regular classes (whether they are affected by aspects or not) you should just be getting incremental builds. If you aren’t we need to look at why and the AJDT event trace view can tell us that - but it can be hard to pick through when there are a lot of projects. I did some work relatively recently to ensure the AJDT event trace view tells us why it is deciding to do full builds - are you able to collect those diagnostics?

I have attempted to use the non-standard compiler options you mentioned in another blog post.

That’s odd because those should all be on by default now, which is why I didn’t suggest them… hmm. Maybe they weren’t default in that 2.2.3 release of AJDT.
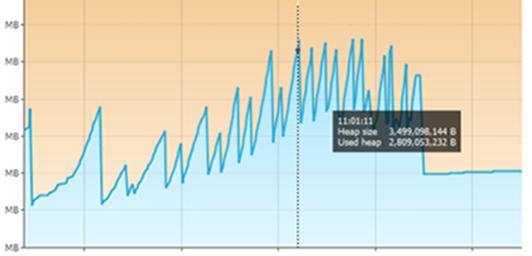
Re: timings.
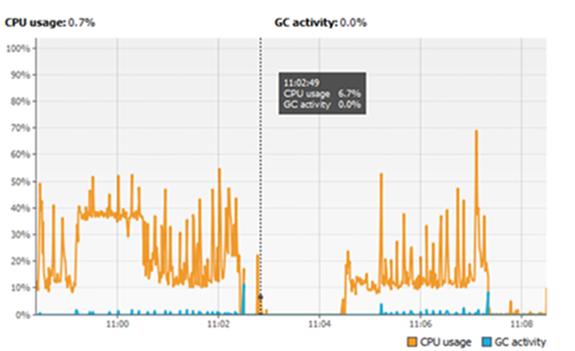
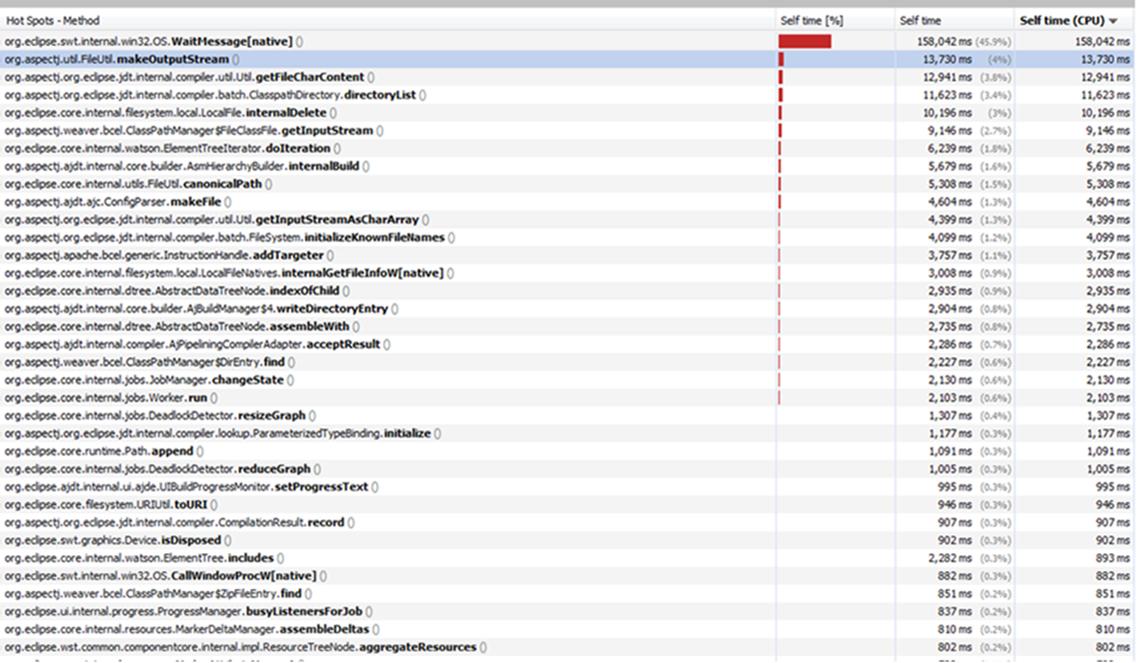
The timers in your attached profiling doc don’t look too bad:
14:55:47 Pointcut matching cost (total=11505ms for 282774 joinpoint match calls):
14:55:47 Pointcut fast matching cost (total=5816ms for 141848 fast match calls):

but I’ll admit I’ve never seen a pointcut with so many ||s in for the return type before. But it shouldn’t cause a big problem.

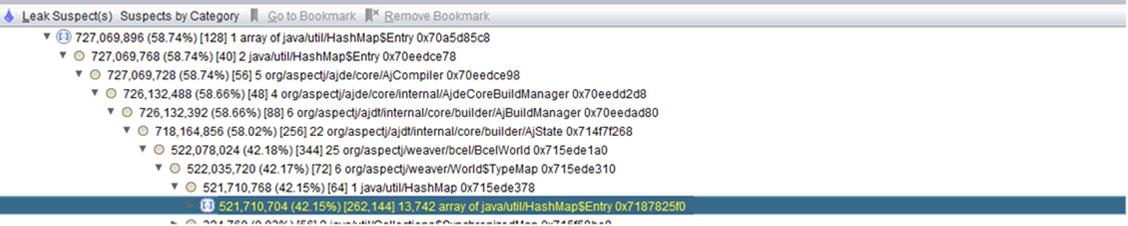
I believe the 17731 is telling us how many types the weaver is fast matching against - so all the types in your system and fast matching quickly gets that down to the 700 of interest using your within() clause. And then the join points within those types are subject to slow matching. As you noted the one involving a constructor call() that takes 9 seconds would be much better as execution() of the constructor if you can arrange that.

It feels a bit like this is morphing from a ‘it takes too long’ into a ‘why is it always full building?’ problem.  I know I put some improved diagnostics in since that 2.2.3 release for working out why full builds are occurring instead of incremental builds - so it is worth installing a dev build and trying things that should cause incremental builds but cause full.  For example, making whitespace changes to non-aspects, that really should only cause incremental builds.

cheers
Andy
-- 
Andy Clement

On 3 October 2014 11:26, Richard Fanning <Richard.Fanning@xxxxxxxxxx> wrote:

Hi Andy,


Thanks for taking the time to respond and providing me with very relevant information..


Here are a few responses and follow-up questions


·         We are using 2.2.3 of AJDT in Eclipse 4.3. We’ve left AJDT using the default RT JAR (1.7.3). I did try it on 1.8.1 but there was no obvious difference.

·         We do not have any cflow pointcuts

·         I wonder if it’s more popular to use aspect with LTW insead of CTW. Perhaps we are approaching this wrong.

·         10404 marker might be about right.. we’re advising all getter and setters in our entities as you say 14 * 700 would get you this and 14 attributes on average in an entity would sound correct.

·         In relation to the markers I’ve attached a file with a few back to back “clean project” calls.. The marker creation times are about 30 sec (299509 à 318863)

o    When profiling and looking at the output I did notice that our project has LOTS of compiler warnings (un-used imports, raw types, type safety, deprecated API calls etc). Would this be adding an extra overhead to AJDT that JDT manages better?

cid:image008.png@01CFDF33.77B46170

·          

·         You are correct the timings I was providing were compile + weave times… Prior to making our AspectJ project an eclipse FULL compile was taking roughly 70 seconds.. So it’s now 1.5 times slower?

o    I’m guessing what makes us more conscious of a FULL compile time now is it seems to occur much more frequently now that the builder is the ajbuilder and we have acpects.. I’m guessing the triggers which I’ve seen in AJDT Trace are affected by the type of pointcuts we have defined. So even though we have Incremental enabled a lot of the time if decides to do a FULL build rather than incremental

·         I have grepped for “org.aspectj.weaver.WeaverState” and it is only in the  700 classes we except to weaved so I’m guessing the other types are that debug information the compiler added.. Also the advise markers and cross references in Eclipse have always looked pretty correct.

·         I have attempted to use the non-standard compiler options you mentioned in another blog post. This improves the stability of Eclipse greatly as much less memory is used however weaving takes much longer initially


17:46:49 Timer event: 2609387ms: Total time spent in AJBuilder.build()

·         So the profiling… I’ve attached the file with the profiling output

o    None of these numbers are particularly shocking…. So I assume these times are not per class file but an overall time spent matching for full weave?

o    The obvious big number is the call advise.. We hope to remove this and place the logic in an execute

o    We do use within() to limit the pointcuts to classes annotated with @Entity yet and we know it only weaves 700 classes yet it seems to find types:#17731 on fast match.. Is within() not behaving as expected

§  Perhaps other wildcard pointcuts are making the match not so certain?

·         When we weave in our build (via ANT) we weave into the byte code.. We invoke the weave command 12 times to account for the various modules and the total time spent weaving is about 2 mins… Which suggests weaving requires a significant amount of time.

o    Unfortunately we are not in a position to split out our eclipse project based on these modules delineations

·         I’ve also attached our aspect (minus the code in the advices) in case that helps when reviewing


Thanks again for helping with this.


Rich


From: ajdt-dev-bounces@xxxxxxxxxxx [mailto:ajdt-dev-bounces@xxxxxxxxxxx] On Behalf Of Andy Clement
Sent: 02 October 2014 17:42
To:
ajdt-dev@xxxxxxxxxxx; aspectj-users@xxxxxxxxxxx
Subject: Re: [ajdt-dev] AJDT Performance Issues


Hi Rich,


Very fortunate I happened to check this ajdt mailing list, I don't do it very often. I tend to hang around on the aspectj users/dev list (or stack overflow) - that might be a better place for the discussion (at least more people will see the discussion).


Anyway, there is a lot to talk about there but let me start at the beginning:


> At this time we have defined a single aspect file which contains ~9 pointcuts and ~ 8 join-points..


You don't define join points. You define pointcuts:


pointcut p(): execution(* somemethod(..));


and advice attached to pointcuts:


before(): p() {...}


Join points are matched by pointcuts. Every program has lots of join points but using the pointcut patterns AspectJ selects a subset to which the advice gets attached.


> I think my terminology is correct in saying we have mostly statically determined pointcuts. 


That is great that they are statically determinable but the cost for matching each one can vary wildly depending on the which elements of the pointcut are specified and which are wildcarded. Using annotations or type names can speed up matching (as large numbers of join points can be dismissed very quickly) but I know you have said you don't want to specify type or package names.


> Right now the pointcuts do have lots of operators (mainly OR’s). Are these know to be less performant? 


Doesn't really matter about the operators. All pointcuts are translated into a DNF form and the individual components are sorted to ensure those cheaper to analyze are first.


> In terms of “Execution Time” the weave process takes ~2.5 mins.


When you say 'weave time' should I assume you mean compile and weave time? i.e. the time from when you press 'clean project' to the time when the whole process finishes?  If your project is an AspectJ project then AspectJ is responsible for compilation and weaving - for compilation it is using a modified variant of the JDT compiler.


> Our eclipse project is large. It consists of 11334 types (files). Of these types we’re expecting that only types annotated with @Entity (~700 classes) would be weaved. But AJDT seems to report that 10404 makers are created and if I search the generated bytecode 19228 class files (of 21058) have references to “org.aspectj” in the bytecode. However only the @Entity classes have the inner $AjcClosure classes so I’m guessing it is advising correctly. Inspecting the non @Entity bytecode which does have references to “org.aspectj” it typically seems to be something like

> org.aspectj.weaver.MethodDeclarationLineNumber: length = 0x8

>  

> Reading online this seems to be some form of debug information? So what we are seeing it is taking 2.5mins+ and potentially weaving more than it should.


grepping through the byte code isn't a great way to tell what was woven. The MethodDeclarationLineNumbers are used if something is advised since Java does not include the line numbers for method declarations. It is produced during compilation, *not* during weaving. I would expect all classes compiled in an AspectJ project to have these MethodDeclarationLineNumber elements in them (if they contain method declarations) so I presume that is why 19228 of your 21058 files have them. If you want to identify which files have actually been woven, grep the byte code for the attribute 'org.aspectj.weaver.WeaverState'. My gut reaction is that 10404 markers feels like a lot but I suppose if you have 700 classes that should be advised, it is only 14 per file.  In the markers view in eclipse have you seen any markers that look wrong?


Perhaps we need to tweak our pointcuts to skip over classes quicker?


Yes, I'm more suspicious of the matching time for pointcuts than the actual weaving time. You don't mention what version of AJDT you are on, I hope it is something recent?


I wrote an article a while back on profiling how long your pointcuts are taking to match:


And here is one on how to see that information in AJDT:


It would be interesting to know if you have any pointcuts that are spending a lot of time in the matching.  And whether you are using the more adventurous pointcut designators like cflow.


> Is it possible to turn off markers (or perhaps only install the weaver) and not take advantage of advise markers.


I've often thought we need that but I don't think we have it right now. Are you able to do a command line build of this project - how does that compare when AJDT is not in the loop?


I'm certainly happy to work with you to dig into this. Taking a look at the pointcuts may be the next step.


cheers,

Andy


On 26 September 2014 05:24, Richard Fanning <Richard.Fanning@xxxxxxxxxx> wrote:

Hi there,


We’re recently started a proof of concept of using AOP (AspectJ) in our existing product/project. At this time we have defined a single aspect file which contains ~9 pointcuts and ~ 8 join-points.. I think my terminology is correct in saying we have mostly statically determined pointcuts. Right now the pointcuts do have lots of operators (mainly OR’s). Are these know to be less performant? The aspect lives in a framework JAR and projects which use this framework configure Eclipse with the framework JAR in the Aspect path.


We’re encountering some performance problems weaving using AJDT in Eclipse and was hoping for some recommendations from this mailing list.


I’d categorize the performance problems as follows


1.       Execution Time

2.       Memory and hanging up Eclipse


In terms of “Execution Time” the weave process takes ~2.5 mins. Full output attached but here are snippets from AJDT trace


11:1:59 Timer event: 212035ms: Total time spent in AJBuilder.build()                                    This is after initial startup

11:7:3 Timer event: 141006ms: Total time spent in AJBuilder.build()                                     This is after subsequently doing a CLEAN build


11:2:23 Created 10404 markers in 11334 files

11:7:17 Created 10404 markers in 11334 files


Our eclipse project is large. It consists of 11334 types (files). Of these types we’re expecting that only types annotated with @Entity (~700 classes) would be weaved. But AJDT seems to report that 10404 makers are created and if I search the generated bytecode 19228 class files (of 21058) have references to “org.aspectj” in the bytecode. However only the @Entity classes have the inner $AjcClosure classes so I’m guessing it is advising correctly. Inspecting the non @Entity bytecode which does have references to “org.aspectj” it typically seems to be something like


org.aspectj.weaver.MethodDeclarationLineNumber: length = 0x8


Reading online this seems to be some form of debug information? So what we are seeing it is taking 2.5mins+ and potentially weaving more than it should. Our aspect does not / can not filter by package.. Does not filter by class name (i.e. our Entity classes are not postfixed with Entity i.e. AccountEntity). Our eclipse setup right now intermingles @Entity classes with other code so we cannot in Eclipse specify an inpath of certain class folders. We are using compile time byte code weaving so can’t use an aop.xml to filter.. So for now let’s assume re-organising the project is not an option where should be look for improving this performance? We are trying to target ~ 700 classes of ~12000 and targeting the classes by classes annotated with @Entity and the aspect then advises various methods of that class. Is that execution time about right? Perhaps we need to tweak our pointcuts to skip over classes quicker?


In terms of 2) Memory usage and eclipse hanging up it’s been a bit of a struggle for developers in Eclipse.. We have incremental compilation enabled but waiting 2.5mins at times really kills productivity. On top of the wait time even with eclipse.ini configured with lots of RAM and multiple VM tuning settings we often need to restart eclipse because


A.      It runs out of memory. Here are some graphics of the memory spikes for the executions above


First Execution


cid:image001.jpg@01CFDF2F.24A2CDE0  cid:image002.jpg@01CFDF2F.24A2CDE0


Second Execution (can still see first)


cid:image003.jpg@01CFDF2F.24A2CDE0  cid:image004.jpg@01CFDF2F.24A2CDE0


Profiling CPU using jvisualvm seems to be a pretty IO intensive operation (as expected)


cid:image005.jpg@01CFDF2F.24A2CDE0


        Here is a graphic of a heap dump I took at one point… Could there be a leak at play?


cid:image006.jpg@01CFDF2F.24A2CDE0


B.      Secondly on occasion the “Delete & Update markers” process will completely hang blocking other threads in Eclipse. It appears as if we’ve entered a loop of some sort.


cid:image007.jpg@01CFDF2F.24A2CDE0


Is it possible to turn off markers (or perhaps only install the weaver) and not take advantage of advise markers.


My Environment


·         Windows 7, Oracle (Sun) JDK Java 7_45 64bit, 8GB RAM, i7 quad core processor


Here are some of the setting from eclipse.ini… Some of these have improved things somewhat


-Xms1024m

-Xmx4048m

-XX:MaxPermSize=512m

-Xverify:none

-XX:+UseG1GC

-XX:-DontCompileHugeMethods

-XX:MaxInlineSize=1024 

-XX:FreqInlineSize=1024

-Xss1m

-XX:+UseCMSCompactAtFullCollection

-XX:+CMSClassUnloadingEnabled

-XX:+DoEscapeAnalysis

-XX:+UseCompressedOops

-XX:+AggressiveOpts

-XX:+ExplicitGCInvokesConcurrentAndUnloadsClasses


Any recommendations/advice would be greatly appreciated. Let me know if you need additional information.


Thanks


Rich


__________________________________________________________
FINEOS Corporation is the global brand name of FINEOS Corporation and its affiliated
group companies worldwide.

The information contained in this e-mail is confidential, may be privileged and is intended
only for the use of the recipient named above. If you are not the intended recipient or a
representative of the intended recipient, you have received this e-mail in error and must
not copy, use or disclose the contents of this e-mail to anybody else. 

If you have received this e-mail in error, please notify the sender immediately by return
e-mail and permanently delete the copy you received.  This e-mail has been swept for
computer viruses. However, you should carry out your own virus checks.
Registered in Ireland, No. 205721.  http://www.FINEOS.com
__________________________________________________________


_______________________________________________
ajdt-dev mailing list
ajdt-dev@xxxxxxxxxxx
To change your delivery options, retrieve your password, or unsubscribe from this list, visit
https://dev.eclipse.org/mailman/listinfo/ajdt-dev


Back to the top